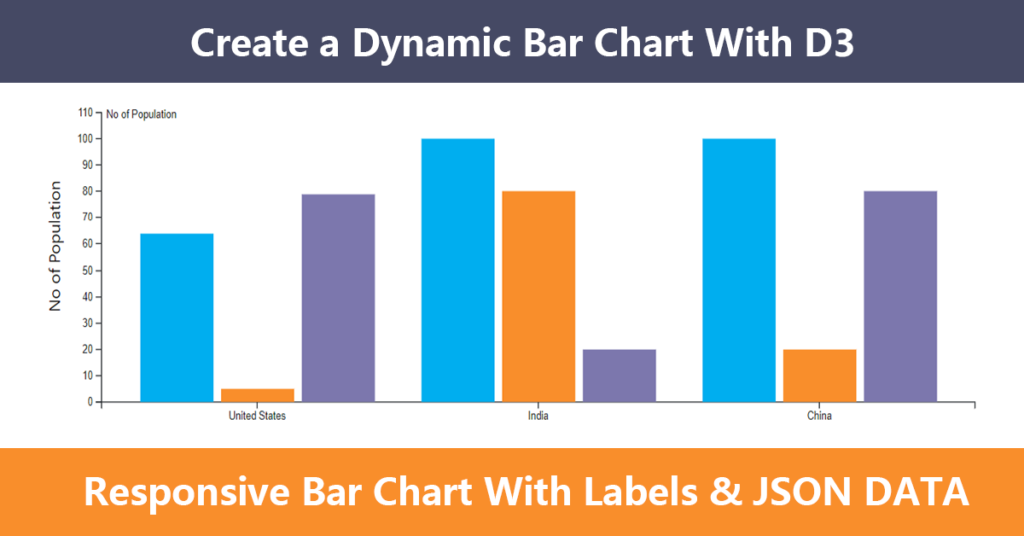
Today in this tutorial we are going to learn how to create a responsive and dynamic bar chart with d3. I saw a lot of tutorials out there in d3 but never got any of them which suits my needs for creating my reporting in bar visualization. It would be the exactly same replica of the d3 vertical bar chart like the image above.
So I have created my own responsive yet d3 vertical bar chart with labels with labels of my own configurations so, that I can switch data on demand without having to change anything. So, today here we are going to create a d3 bar chart with json data which we are going to feed such a way that you can manage your data very well while drawing it.
Let’s get started
What are we going todo ?
- Create a HTML file with Bootstrap CSS and import D3 from CDN
- Create an div with row and col-md-12 class and div with some id which will be using later to draw inside it using d3.
- Finally we are going to create use d3 to create a chart using JavaScript and features provided by the d3 library.
How to Draw Dynamic Bar Chart With D3
So, as we are going to draw everything inside the <script></script> , I am going to write everything in comments after step number 3.
If you don’t have time and want to get the copy of this tutorial, you can get it from my GitHub link here. Let’s move ahead with step 1.
Step 1 – Creating an HTML file with default Bootstrap start layout and import D3 V6 from CDN
However, we dont need bootstrap while drawing a chart. We are solely going to use D3 library in order to manipulate DOM and create the SVG, but i am kind of lazy creating layouts to align the div properly in the center. So, I know you too are lazy so, you just have to import these two inside your head tag.
<link href="https://cdn.jsdelivr.net/npm/bootstrap@5.0.1/dist/css/bootstrap.min.css" rel="stylesheet"><script src="https://d3js.org/d3.v6.min.js"></script>Step 2 – Creating a DIV element with unique ID
We are going to create an div element with an id called svg-container which we will wrap around with bootstrap container & its row grid classes to make it align center, where we will start manipulating the DOM and draw the chart.
|
1 2 3 4 5 6 7 |
<div class="container-fluid"> <div class="row"> <div class="col-md-12"> <div id="svg-container"></div> </div> </div> </div> |
Step 3 – Let’s Start Drawing the Chart
So I assume that you are inside your <script></script> tag and we are going to start drawing our chart using the D3 library. So, first let’s create some of the input parameters for the bar chart so that we can make it highly configurable.
- Define height of the bar chart. We don’t need width as we are going take the dynamic width of screen which will be 100% based on screen size.
- Define margin from all the direction like top, left, down and right.
- Inner padding which we are going to use it to add spaces between the bars of an chart
- Outer padding which we are going to add spaces at the beginning of starting and end of bar chart.
- Series inner padding to adjust the bars spaces inside the single x-axis group.
- Rest of them are bar colors, labels that you want to keep vertically aligned with the x-axis.
- Finally we are going to create a function called
createChart()inside which we were going to construct a chart.
It seems over whelming at first but you will soon understand as we constantly proceed into the code and view their comments. So let’s create some input parameters. These input parameters will be more clear when you start to see its usage.
|
1 2 3 4 5 6 7 8 9 10 11 12 |
// Bar Chart params (configurable) const input_params = { height: 300, margin: { top: 10, left: 50, right: 10, bottom: 10 }, xScaleLabelHeight: 25, innerPadding: 0.1, outerPadding: 0.1, seriesInnerPadding: 0.1, reduceBarWidth: 0, barColors: ['#00aeef', '#f98e2b', '#7C77AD'], yAxisLabel: 'No of Population', }; |
JSON Data
|
1 2 3 4 5 6 7 8 9 10 11 12 13 14 15 16 17 18 19 20 21 22 23 24 25 26 |
const chart_data = [ { group: 'United States', series: [ { name: 'Total population', value: 64 }, { name: 'Infected population', value: 5 }, { name: 'Safe population', value: 79 } ] }, { group: 'India', series: [ { name: 'Total population', value: 100 }, { name: 'Infected population', value: 80 }, { name: 'Safe population', value: 20 } ] }, { group: 'China', series: [ { name: 'Total population', value: 100 }, { name: 'Infected population', value: 20 }, { name: 'Safe population', value: 80 } ] } ]; |
Drawing Bar Chart
|
1 2 3 4 5 6 7 8 9 10 11 12 13 14 15 16 17 18 19 20 21 22 23 24 25 26 27 28 29 30 31 32 33 34 35 36 37 38 39 40 41 42 43 44 45 46 47 48 49 50 51 52 53 54 55 56 57 58 59 60 61 62 63 64 65 66 67 68 69 70 71 72 73 74 75 76 77 78 79 80 81 82 83 84 85 86 87 88 89 90 91 92 93 94 95 96 97 98 99 100 101 102 103 104 105 106 107 108 109 110 111 112 113 114 115 116 117 118 119 120 121 122 123 124 125 126 127 128 129 130 131 132 133 134 135 136 137 138 139 140 141 142 143 144 145 146 147 148 149 150 151 152 153 154 |
const createChart = (chart_data) => { // create svg d3.select('svg').remove(); svg = d3.select('#svg-container') .append('svg') .attr('width', '100%') .attr('height', input_params.height) .append('g') .attr('transform', 'translate(0,0)') .attr('class', 'vertical-bar-chart'); // set left and right margin for the barchart container const margin = { top: input_params.margin.top, right: input_params.margin.right, bottom: input_params.xScaleLabelHeight, left: input_params.margin.left }; // Give some space for label before the yAxis so it does'nt get overlapped margin.left = input_params.yAxisLabel ? input_params.margin.left + 20 : margin.left // Get the actual Width of the container (Returns the dynamic width depends upon the screen resolution) const width = d3.select('#svg-container').node().getBoundingClientRect().width - margin.left - margin.right; let height = input_params.height - margin.top - margin.bottom; // prepare bar chart domain const prepareDomainBar = () => { let domain = null; if (input_params.domain) { domain = input_params.domain; } else { const bar_values = [].concat(...chart_data.map(item => item.series.map(j => j.value))); domain = [(d3.min(bar_values) > 0 ? 0 : d3.min(bar_values)), (d3.max(bar_values) * 1.01)]; } input_params.domain = domain; return domain; } // Fetching the group from the data array to create x-axis const groups = chart_data.map(item => item.group); const xAxisGroupLabels = chart_data.length > 0 ? chart_data[0].series.map(item => item.name) : []; const domain = prepareDomainBar(); // Setting up bandscale for spacing groups const getBandScale = (domain, range, innerPadding, outerPadding) => { const scale = d3.scaleBand() .range(range) .domain(domain) .paddingInner(input_params.innerPadding) .paddingOuter(input_params.outerPadding); // Naming it as a Scale of type BAND scale.type = 'BAND'; return scale; } // Get bandscale const x0 = getBandScale(groups, [0, width], input_params.innerPadding, input_params.outerPadding).round(true); const x1 = getBandScale(xAxisGroupLabels, [0, x0.bandwidth()], input_params.seriesInnerPadding, input_params.outerPadding).round(true); // create chart group let chart = svg.selectAll('g.chart').data([{}]); chart = chart.enter() .append('g') .attr('class', 'chart') .merge(chart) .attr('transform', `translate(${margin.left}, ${margin.top})`); // create another chart group wrapper inside chart group (We may not be needing it but i like to be everything clean) let chartGroup = chart.selectAll('g.chart-wrapper').data([{}]); chartGroup = chartGroup.enter() .append('g') .attr('class', 'chart-wrapper') .merge(chartGroup) .attr('transform', 'translate(0, 0)'); // Create X-AXIS const xAxisGroup = chartGroup.selectAll('g.x-axis').data([{}]); xAxisGroup.enter() .append('g') .attr('class', 'x-axis') .merge(xAxisGroup) .attr('transform', `translate(0, ${height})`) .call(d3.axisBottom(x0)) .selectAll('text') .style("text-anchor", "middle"); // create bar group wrappers to create bars let barGroupWrapper = chartGroup.selectAll('g.bar-group-wrapper').data([{}]); barGroupWrapper.exit().remove(); barGroupWrapper = barGroupWrapper.enter() .append('g') .attr('class', 'bar-group-wrapper') .merge(barGroupWrapper); // create bar group let barGroup = barGroupWrapper.selectAll('g.bar-group').data(chart_data); const dataLength = chart_data[0].series.length; barGroup.exit().remove(); barGroup = barGroup.enter() .append('g') .attr('class', 'bar-group') .merge(barGroup) .attr('transform', d => `translate(${input_params.reduceBarWidth ? (dataLength > 1 ? input_params.reduceBarWidth / dataLength : input_params.reduceBarWidth * 1.5) : x0(d.group)}, 0)`); // Prepare Y-AXIS const y = d3.scaleLinear().domain(domain).nice().rangeRound([height, 0]); let yAxisGroup = chartGroup.selectAll('g.y-axis').data([{}]); yAxisGroup = yAxisGroup.enter() .append('g') .attr('class', 'y-axis') .merge(yAxisGroup) .call(d3.axisLeft(y)); // yAxis Top Unit Text const axisUnitText = yAxisGroup.selectAll('text.axis-unit').data([{}]); axisUnitText.enter() .append('text') .attr('class', 'axis-unit') .merge(axisUnitText) .attr('x', 5) .attr('y', y(y.ticks().pop())) .attr('dy', '0.32rem') .attr('text-anchor', 'start') .style('fill', '#222') .text(input_params.yAxisLabel) // SET Y-AXIS LABEL let yAxisLabelSelection = svg.selectAll('text.y-axis-label-temp').data([chart_data.yAxisLabel]); yAxisLabelSelection = yAxisLabelSelection.enter() .append('text') .attr('class', 'y-axis-label-temp') .attr('y', 10) .attr('x', -height / 2) .attr('dy', '1em') .attr('transform', 'rotate(-90)') .style('text-anchor', 'middle') .merge(yAxisLabelSelection); yAxisLabelSelection.text(input_params.yAxisLabel); const barRects = barGroup.selectAll('rect.bar').data(d => d.series.map(item => item)); barRects.enter() .append('rect') .attr('class', 'bar') .attr('width', x1.bandwidth()) .attr('height', d => height - y(d.value)) .attr('x', d => x1(d.name)) .attr('y', d => y(d.value)) .attr('fill', (d, i) => input_params.barColors[i]); } |
Now, all you can do is call the createChart(param) function and pass the JSON data as the parameter to see the rendered chart. Only the last thing you have do us now to set the resize event when the browser window is resized it will automatically adjust with the screen making it a responsive yet dynamic bar chart with d3.
window.addEventListener('resize', (event) => createChart(chart_data));
createChart() function. Also the the labels, margin, padding and color of the bar chart will adjust automatically with the changes your have kept inside the input_params object.That’s it it. So you will have cool looking bar chart with lots of configurable options. The picture attached with this post is the exactly the type of image that you will get while using the references of my codes.
Leave a Reply