Hello guys today, I am going to show you how to create a vertical grouped bar chart using d3v6 by using JSON data example. You know it is very time consuming to create a interactive bar chart and it is not really available out there.
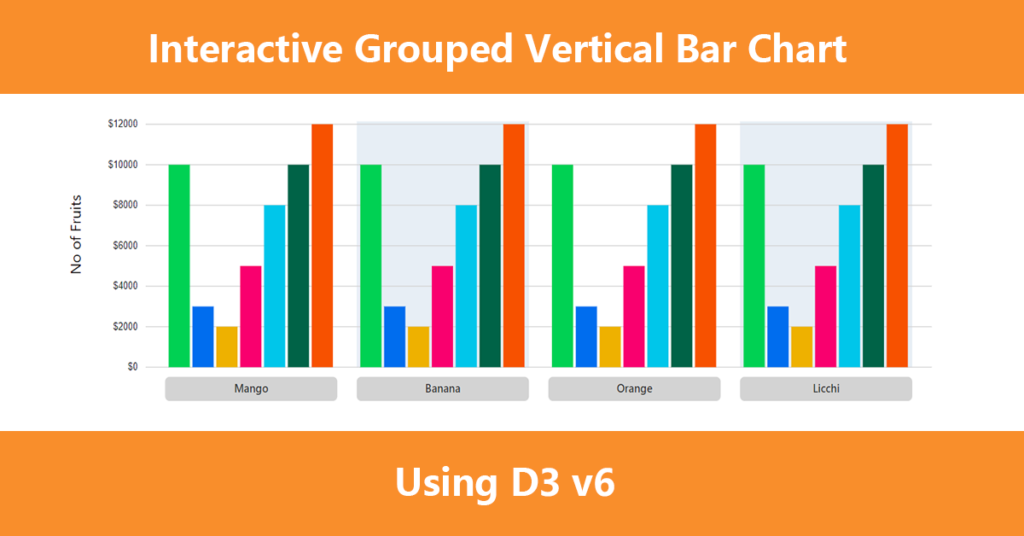
Recently on one of my projects I created a new, yet interactive bar-chart which can create grouped bar chart with any number bar inside one axis group which you can see in the image above.
I have shared the copy of my chart in this link in GitHub. You can download it from here.
Below, I will explain all the details on how to pass data into it and load the chart according to your data.
D3 Interactive Grouped Bar Chart With JSON Data Example
As you know it is very a hectic task to take all day and write a chart with D3. Some of your might find examples around d3 sample gallery but it is not kind of like what we always expect.
I have also wrote a article recently in creating a simplest grouped bar chart using d3 in my recent post. So this time its interactive grouped bar chart which looks professional.
So, taking those things in mind I crafted my own way of creating vertical grouped bar chart with d3v6 with the ability to configure by using the external parameters. I believe you have downloaded the copy of my chart and had look into the methods I have created on it.
The main method that draws a chart is called createChart(); which takes an data as an parameter. It’s JSON structure looks like below.
You can call createChart() from anywhere in the script or may be you in your use case, when you click something and render different kind of data, you can just invoke your function prepare JSON data like above and feed it to createChart(); function and call it. The chart will automatically render on your screen.
Digging Deeper
So, let’s say made the chart once and you want it to use every possible places without having to change the code of native chart you had made. So to do that everything should be params based and totally configurable. So what I have done is made it totally params based.
The thing that you would like to do like changing bar colors. Changing the color of xaxis labels adding backgrounds, and changing the number of ticks according to the nature of your data and adding vertical labels to the yaxis, adding background shadows and much much more. They are totally configurable outside of chart.
I introduced a new object called INPUT_ATTRIBUTES which have tons of parameters I would explain below and how to use it so, that you can get the interactive chart as you have seen on this post image on top of screen. So, let’s get going
height
Specify height of the bar chart.
margin
Margin is basically the spaces that you would like to set around your SVG container and bar chart. It has 4 options as top, left, right bottom which you can customize chart spacing according yo our needs.
xAxisLabelHeight
This is the space below the x-axis. You can set the number of height starting just below the x-axis. By default its value is 35. It is the normal spacing that I have added but you can change it else you don’t have to override any of its value.
innerPadding
Inner Padding is the padding between the each x-axis group. You can change it to have more spaces between the x-axis bars. The default value is 0.1. Value range from 0.1 to 1 on average.
OuterPadding
Outer Padding is padding that starts with first bar of the graph and ends last bar of the graph. That means it will squeeze your bars. Use inner padding and outer padding in combine to adjust your graph to your liking. The default value is 0.1
seriesInnerPadding
Series Inner Padding is the padding between the each of the bars between the bars of each x-axis. You can make it thin or fat depending upon your requirement. Defualt value is 0.1
reduceBarWidth
Reduce Bar Width value is generally the value that is divided by the total number of bars to adjust it in x-axis. Later you can adjust it more using series inner padding, outer padding and series Inner padding to adjust the way in your liking. Be careful while changing its inner value. Its default value is 0.
yAxisLabel
Y Axis label is the type string. Pass the name that you would like to display vertical label on left side of y-axis You can pass it null for not to display it.
noOfTicks
No of ticks represents the number of value that you would like to display on y-axis. It generally displays on the gap of 1000 or 100 depending upon the value. But if you provide noOfTicks it will display 5 values calculating the difference from the values of your data. Default value is 5
yAxisTickFormat
This tick format represents the value representation. Is it either in dollars or rupees or an count or values per thousand or %. By default the value is '$' but you can change it and display according to your nature of data.
domain
Domain is the representation of value starting from 0. It is in array format [0, 10000]. You can pass it externally else it will calculate the domain on range based on your JSON data.
rotationOffset
Rotate offset value for x-axis labels. It will determine when you want to rotate the x-axis label when you bars are many of you want to squeeze your screen resolution. The default value is [0, 0] is array format. Tinker with it to see the changes in chart.
isRotateXAxisLabel
It is the boolean value and is true by default. If you don’t want your x-axis to rotate set it to false.
isChartWithNoAxis & isChartWithNoXAxis
Sometime all you need is to display bars only no x-axis no y axis no axis nothing. So in that case you just have to set isRotateXAxis label to false and these two to true.
xLabelStrokeColor
Set the color stroke for x-axis label background. It is string type and default is grey.
backgroundBarColorCodes
To make bar chart more elegant and professional we have added alternate background color covering entire y-axis height of single x-axis. So provide the color code of your own liking by providing value in array. The default color code is ['#E1EAF2', 'none'].
isShowAlternativeBackGroundColor
It controls whether to show alternative background color in the graph or not. It is boolean, So default value is false. Set it to true.
alternateBackgroundColorOpacity
Generally alternate background is transparent so sometime opacity needs to be customized according to the user. So we have added this feature to set the opacity of alternate background color in which default value is 0.8
showBarValuesOnTop
It shows the total value of bar on top of each bar. Well it is heavily customize the the width of the value is higher than the bar it hides and if its fits it displays value. It is also controlled by boolean value. It is false by default.
That is it with grouped bar chart with JSON data example. If you are happy with the chart made here, make sure to share it on social media platforms.
Leave a Reply